
P-Signal 策略
温馨提示:本文最后更新于2021年12月1日 17:28,若内容或图片失效,请在下方留言或联系博主。
1.策略原理
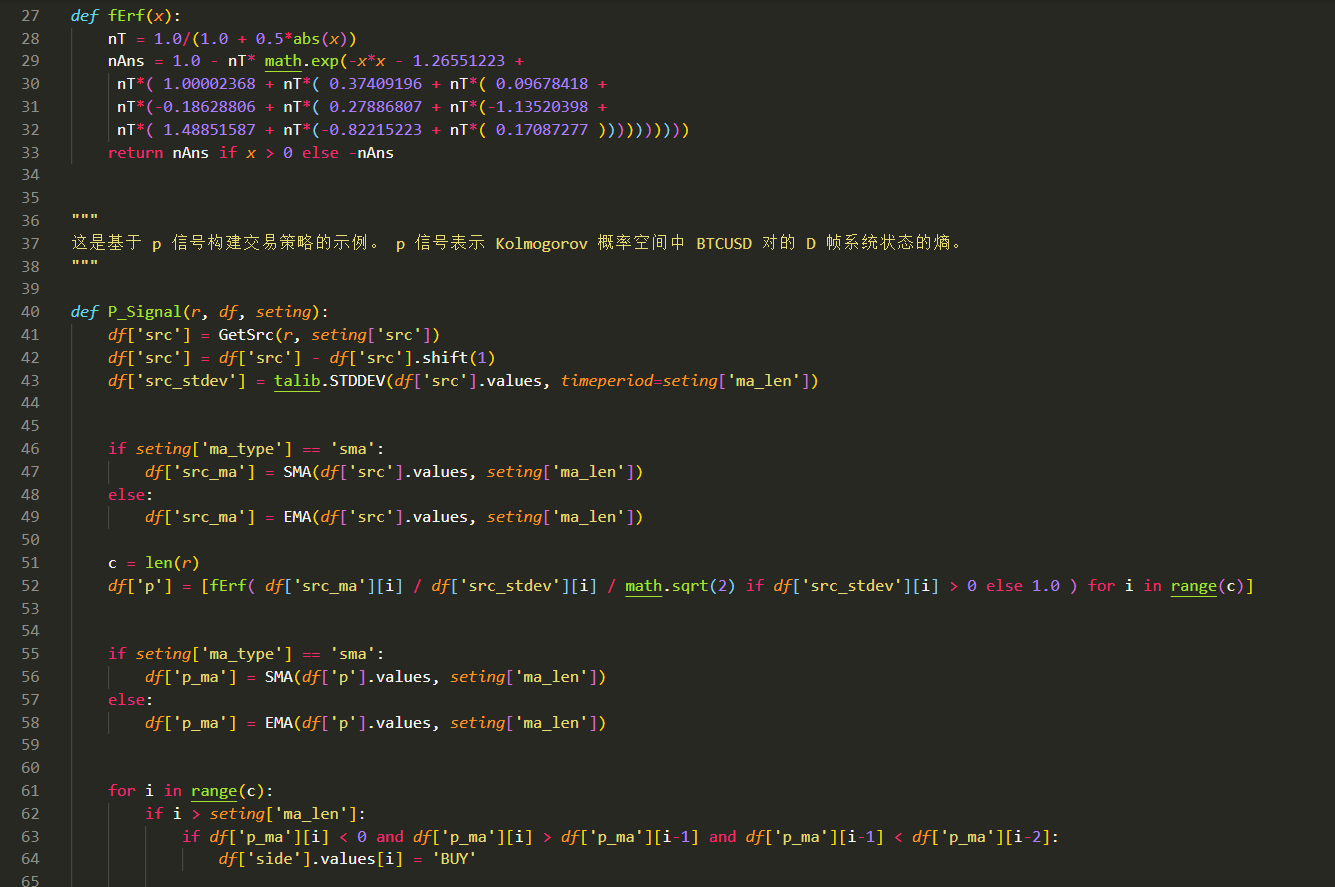
这是基于 p 信号构建交易策略的示例。 p 信号表示 Kolmogorov 概率空间中 交易对的 D 帧系统状态的熵。
TradingView完整源码:
strategy("P-Signal Strategy:", precision = 3)
//
// Parameters and const of P-Signal.
//
nIntr = input(title = "Number of Bars", type = input.integer, defval = 9, minval = 4, maxval = 100, group = "Parameters of observation.")
bSmooth = input(title = "Smoothing", type = input.bool,  defval = true, group = "Parameters of observation.")
//
// Horner's method for the error (Gauss) & P-Signal functions.
//
fErf(x) =>
    nT = 1.0/(1.0 + 0.5*abs(x))
    nAns = 1.0 - nT*exp(-x*x - 1.26551223 +
     nT*( 1.00002368 + nT*( 0.37409196 + nT*( 0.09678418 +
     nT*(-0.18628806 + nT*( 0.27886807 + nT*(-1.13520398 +
     nT*( 1.48851587 + nT*(-0.82215223 + nT*( 0.17087277 ))))))))))
    x >= 0 ? nAns : -nAns

fPSignal(ser, int) =>
    nStDev = stdev(ser, int)
    nSma = sma(ser, int)
    fErf(nStDev > 0 ? nSma/nStDev/sqrt(2) : 1.0)
//
// Signals on Set of Frames.
//

nPSignal = fPSignal(change(ohlc4), nIntr)
nPSignal := if (bSmooth)
    sma(nPSignal, nIntr)
ndPSignal = sign(nPSignal[0] - nPSignal[1])
//
// P-Signal plotting.
//
hline(+1.0, color = color.new(color.orange,70), linestyle = hline.style_dotted)
hline(-1.0, color = color.new(color.orange,70), linestyle = hline.style_dotted)
plot(nPSignal, color = nPSignal > nPSignal[1] ? color.green : color.red, style = plot.style_line)
//
// Strategy "A penny saved is a penny earnd." Caution with short!
//
strategy.entry("long", strategy.long, when = nPSignal < 0 and ndPSignal > 0)
strategy.close("long", when = nPSignal > 0 and ndPSignal < 0)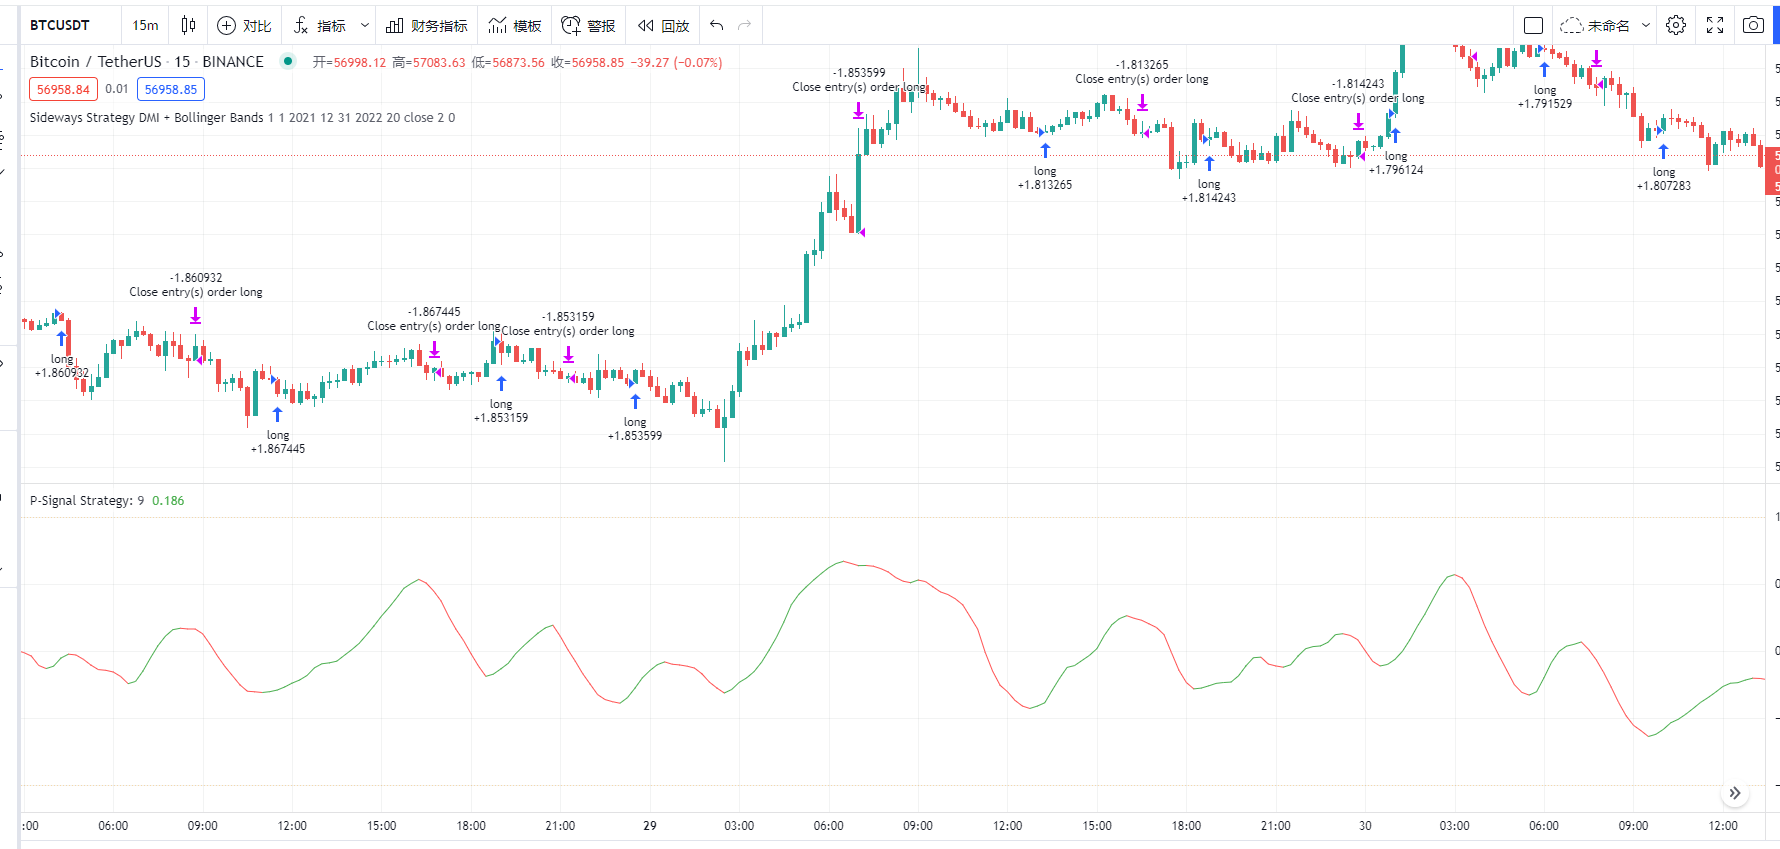
Python实现:
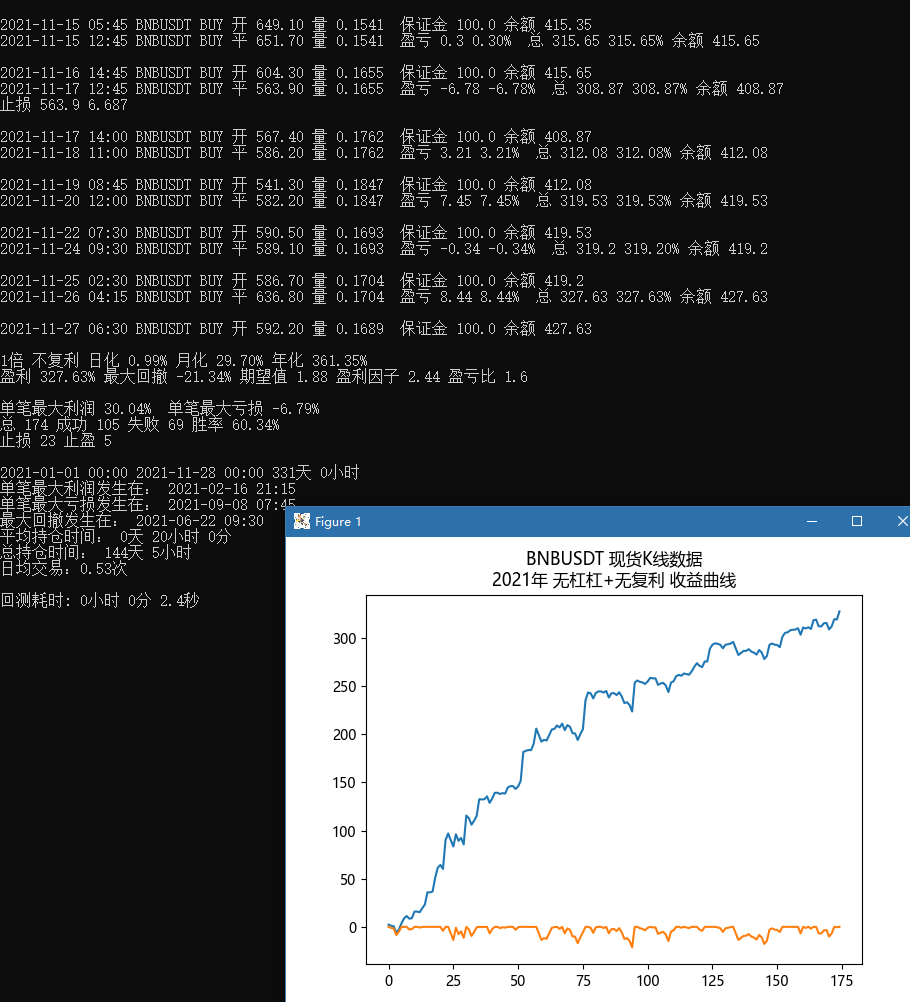
2. 回测结果
K线15m 手续费万4% MA周期60 止盈30% 止损6.6%
2021年: